
Snitchnotes Team
Price Ceiling vs Price Floor: Differences and Examples
Price Ceiling vs Price Floor: Differences and Examples
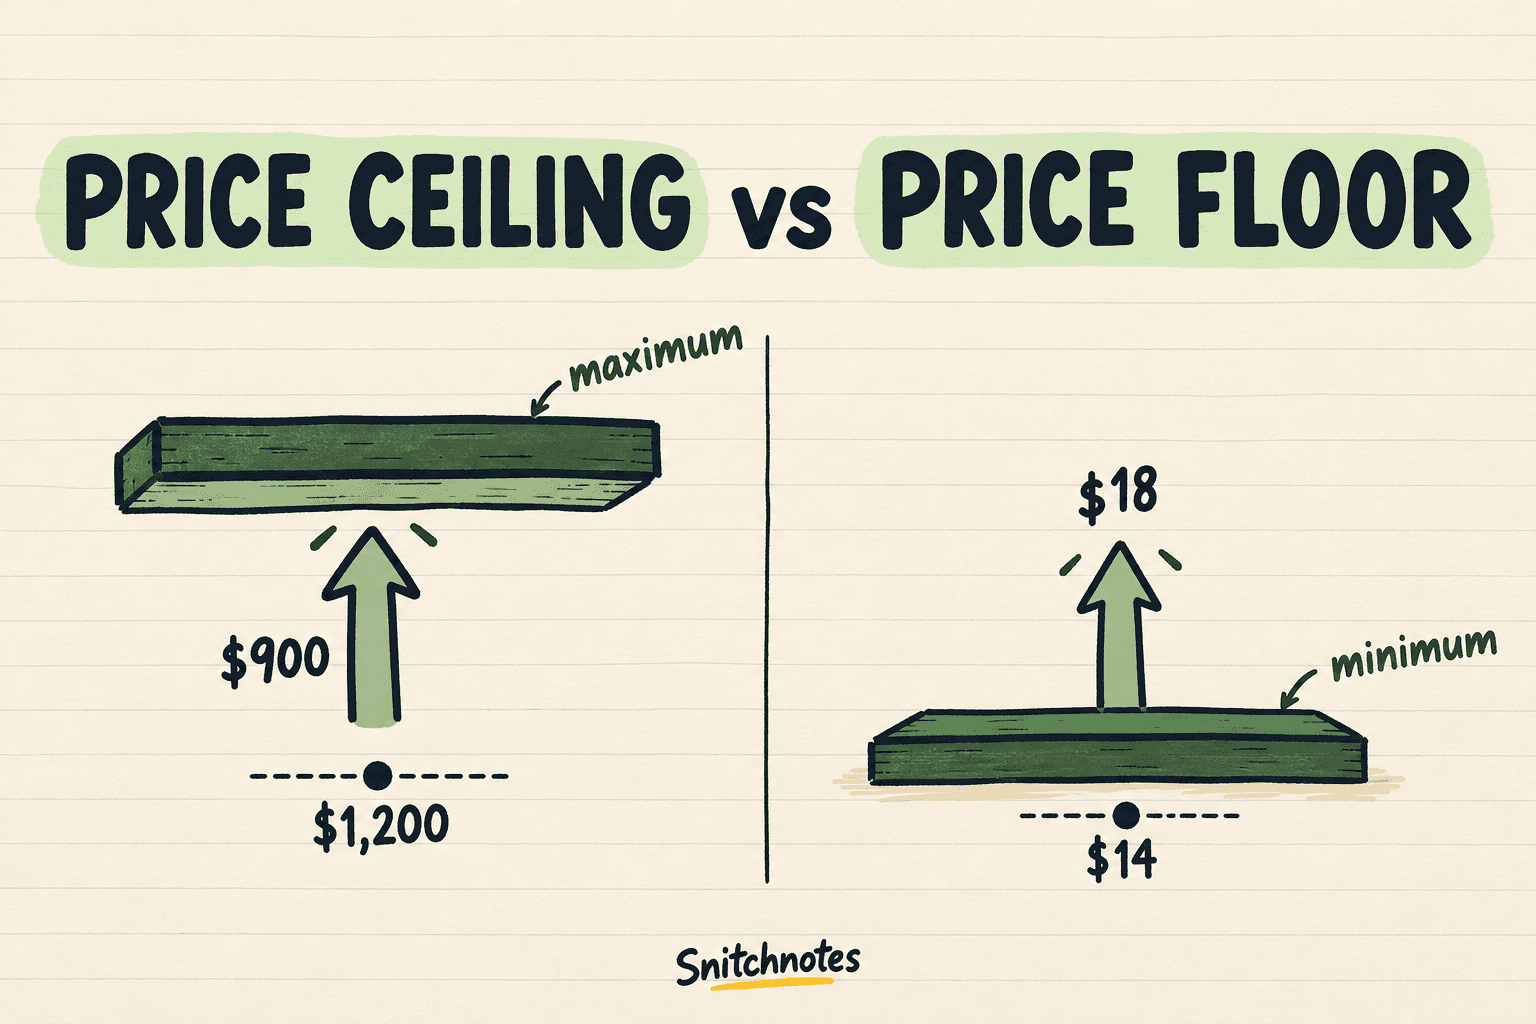
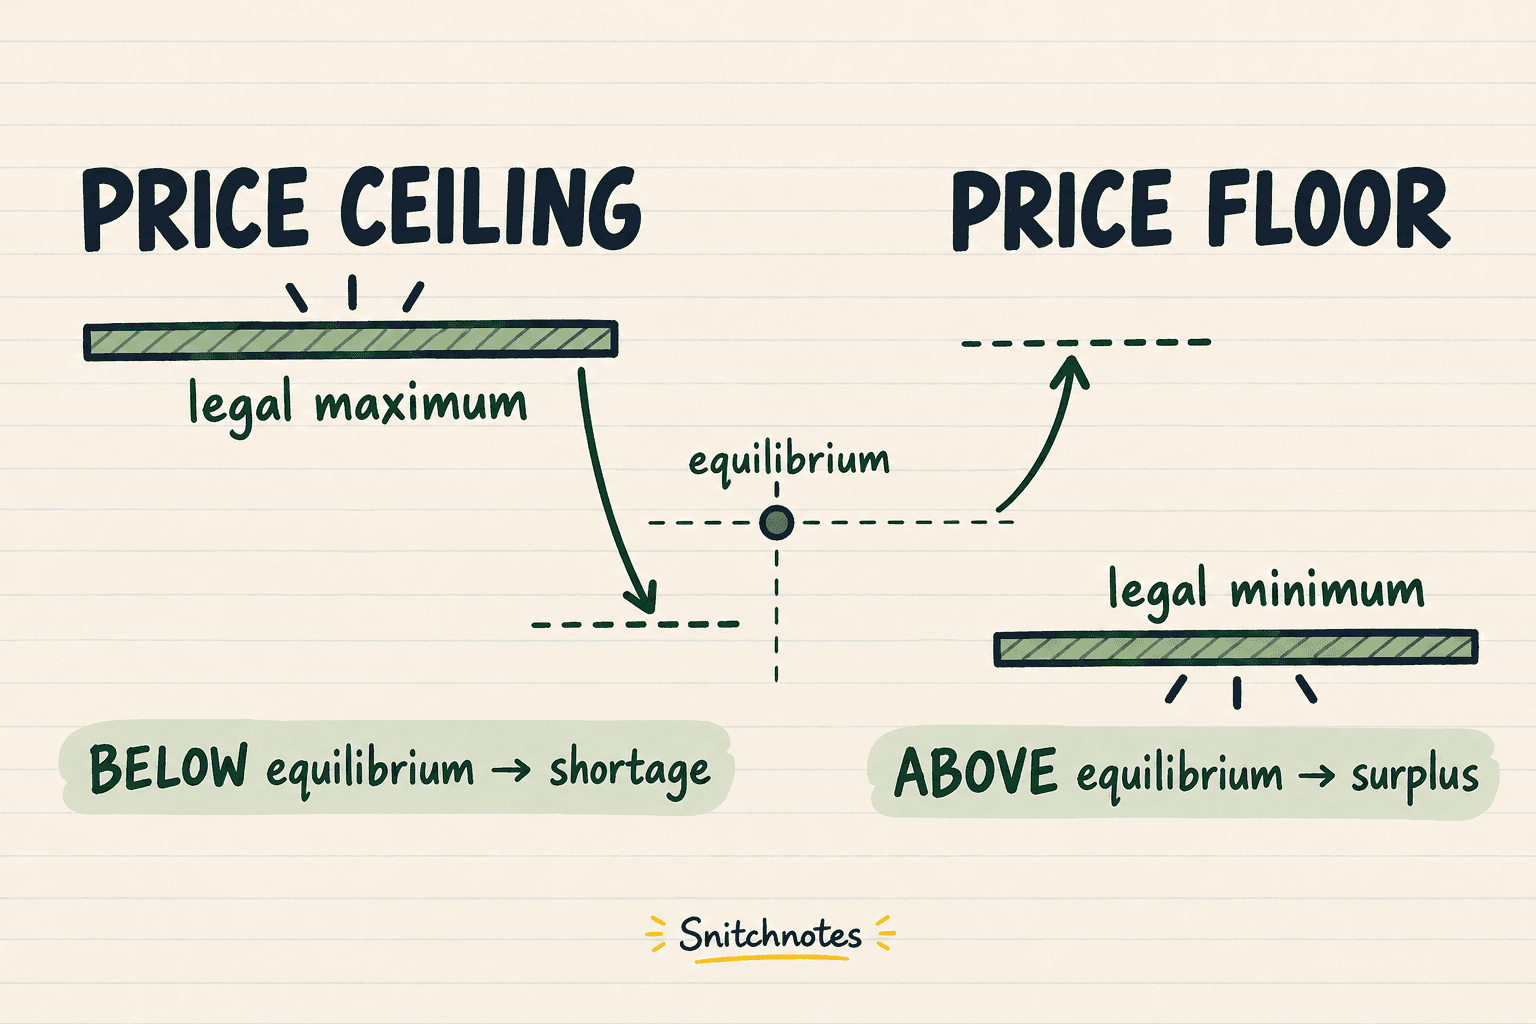
A price ceiling is a legal maximum price, while a price floor is a legal minimum price. In the standard supply-and-demand model, a ceiling changes the market only when it is set below equilibrium; then quantity demanded exceeds quantity supplied, creating a shortage. A floor changes the market only when it is set above equilibrium; then quantity supplied exceeds quantity demanded, creating a surplus.
The quickest memory rule is literal: a ceiling stops a price from going up, and a floor stops it from going down. The harder—and more useful—step is comparing the legal limit with the equilibrium price. We will do that with a $900 rent ceiling and an $18 wage floor.
Price ceiling vs price floor at a glance
A price ceiling says sellers may not charge more than a stated amount. Rent controls and emergency caps on essential goods are common examples. A price floor says buyers may not legally pay less than a stated amount. Minimum-wage laws and some agricultural price supports are examples. The U.S. Department of Labor, for instance, describes the federal minimum wage as a legal requirement under the Fair Labor Standards Act.
- Ceiling = maximum. If it binds below equilibrium, the usual result is a shortage: Qd > Qs.
- Floor = minimum. If it binds above equilibrium, the usual result is a surplus: Qs > Qd.
- A control on the harmless side of equilibrium is nonbinding, so the market can still reach equilibrium.
Why does this matter? Price controls do not remove supply and demand. They change the price at which buyers and sellers must make decisions. The Federal Reserve's education materials explain that equilibrium is the point where quantity demanded equals quantity supplied; a binding control prevents price from moving to that clearing level.
Price ceiling example: a $900 rent cap
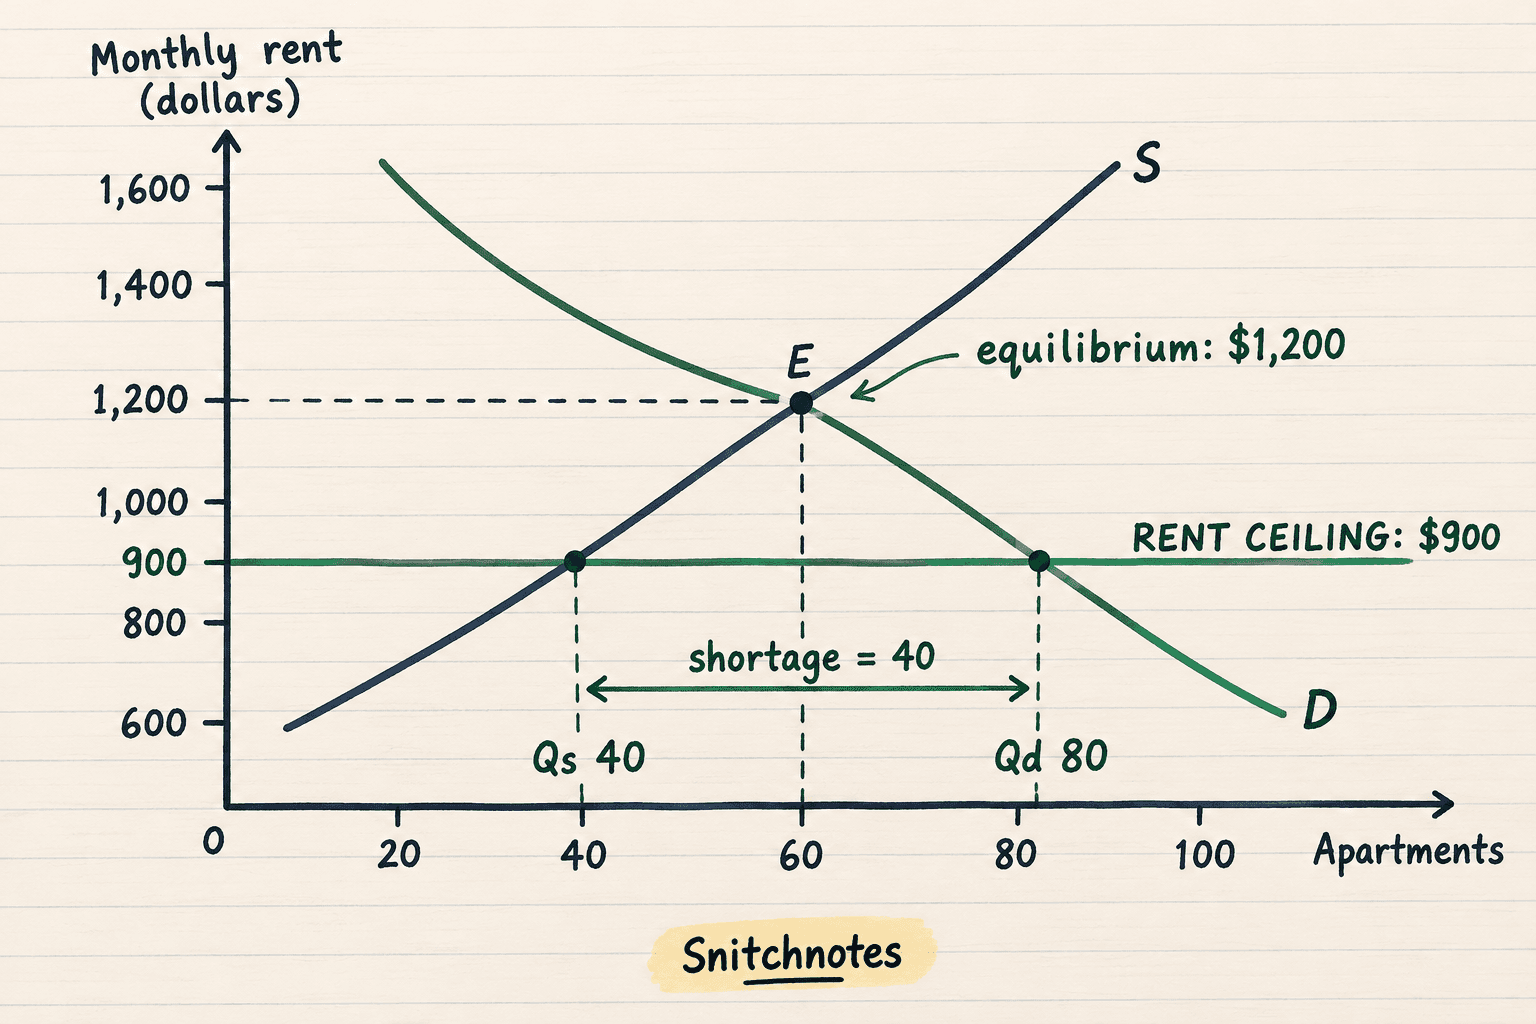
Imagine a small apartment market with an equilibrium monthly rent of $1,200 and 60 apartments rented. The city introduces a maximum legal rent of $900. Because $900 is below $1,200, the ceiling is binding: landlords cannot charge the equilibrium rent.
At the lower price, suppose renters demand 80 apartments while landlords supply 40. The shortage is quantity demanded minus quantity supplied: 80 − 40 = 40 apartments. Forty is the gap, not the number actually rented. Transactions are limited by the short side of the market, so at most 40 apartments are available in this simplified example.
The lower posted rent can help renters who obtain an apartment, but it does not guarantee one for every renter. Some allocation must occur through waiting, search, eligibility rules, connections, or another non-price mechanism. OpenStax uses rent control to show the same core result: when the controlled price is below equilibrium, quantity demanded exceeds quantity supplied.
Price floor example: an $18 minimum wage
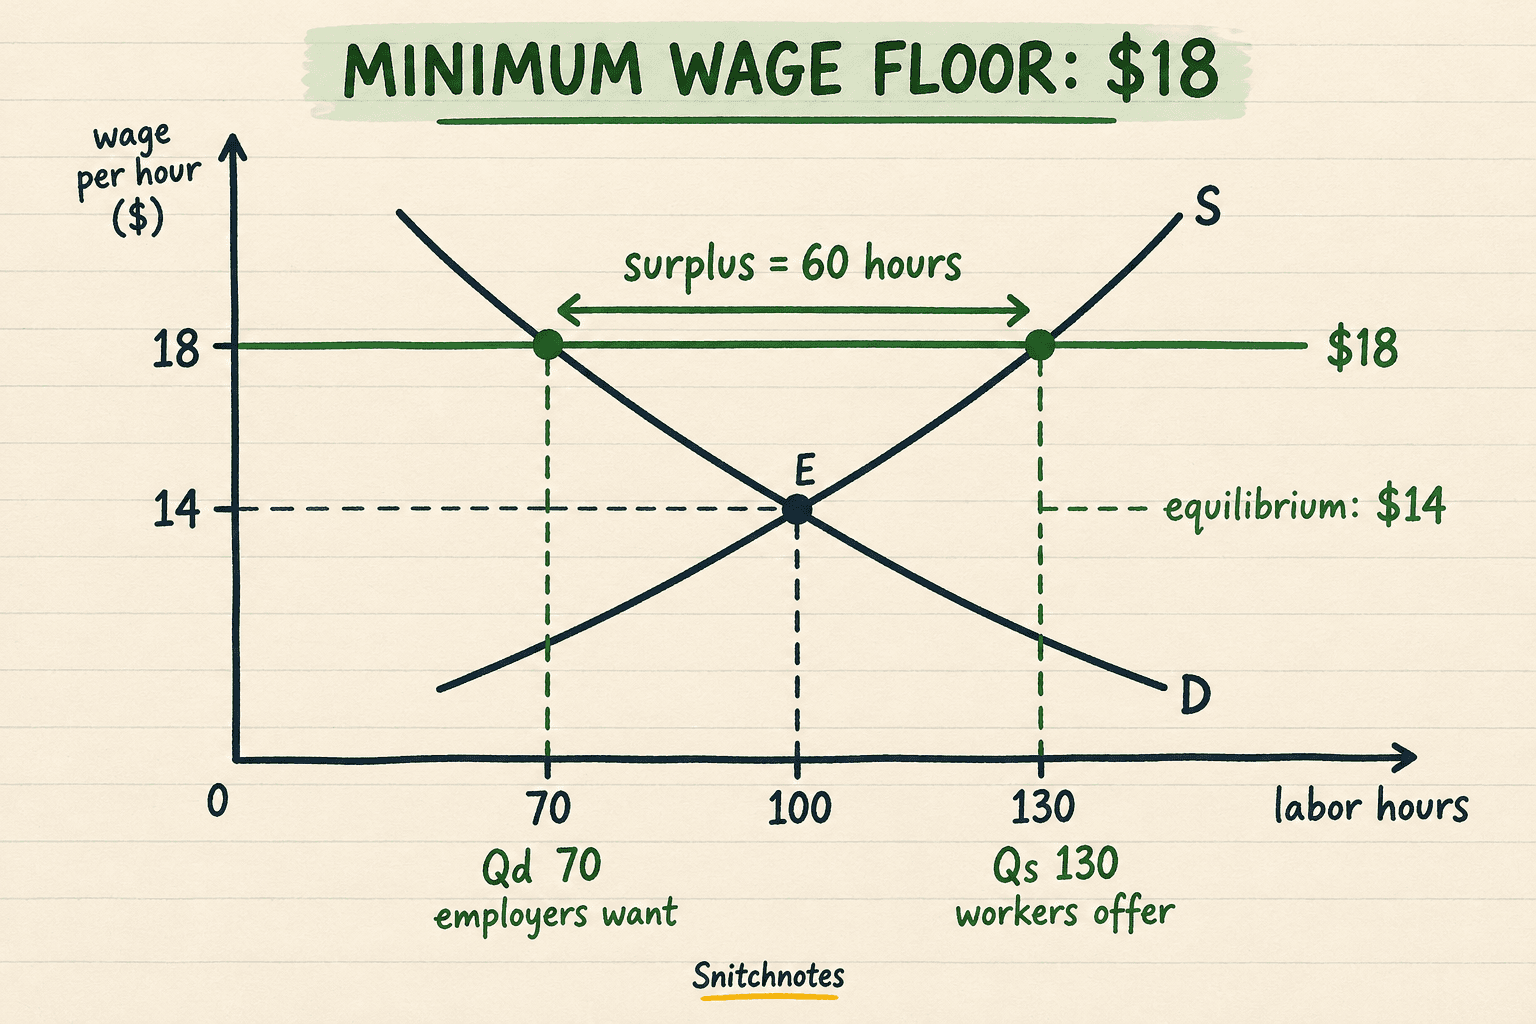
Now consider a simplified competitive labor market. Suppose the equilibrium wage is $14 per hour and the equilibrium quantity is 100 labor hours. A legal minimum wage of $18 is above equilibrium, so this price floor is binding. Employers move along their labor-demand curve and want fewer hours, while workers move along their labor-supply curve and offer more.
Assume employers demand 70 labor hours at $18 and workers supply 130. The surplus is quantity supplied minus quantity demanded: 130 − 70 = 60 hours. In a labor-market diagram, that excess supply can represent labor offered but not hired under the model's assumptions. The amount of employment is constrained by demand, the short side, so 70 hours are exchanged in this example.
This graph is a teaching model, not a complete verdict on any real minimum-wage policy. Actual effects depend on the size of the increase, market power, worker and firm responses, enforcement, exemptions, and time. The St. Louis Fed notes that price controls can behave differently in imperfectly competitive markets. Use the diagram to classify the control and predict the basic competitive-model gap—not to skip empirical evidence.
How to tell whether a price control is binding
- Identify the rule. Maximum means ceiling; minimum means floor.
- Find the equilibrium price where the supply and demand curves intersect.
- Compare the control with equilibrium. A ceiling binds below equilibrium; a floor binds above it.
- Read Qd and Qs at the controlled price, not at equilibrium.
- Calculate the gap. For a shortage use Qd − Qs; for a surplus use Qs − Qd.
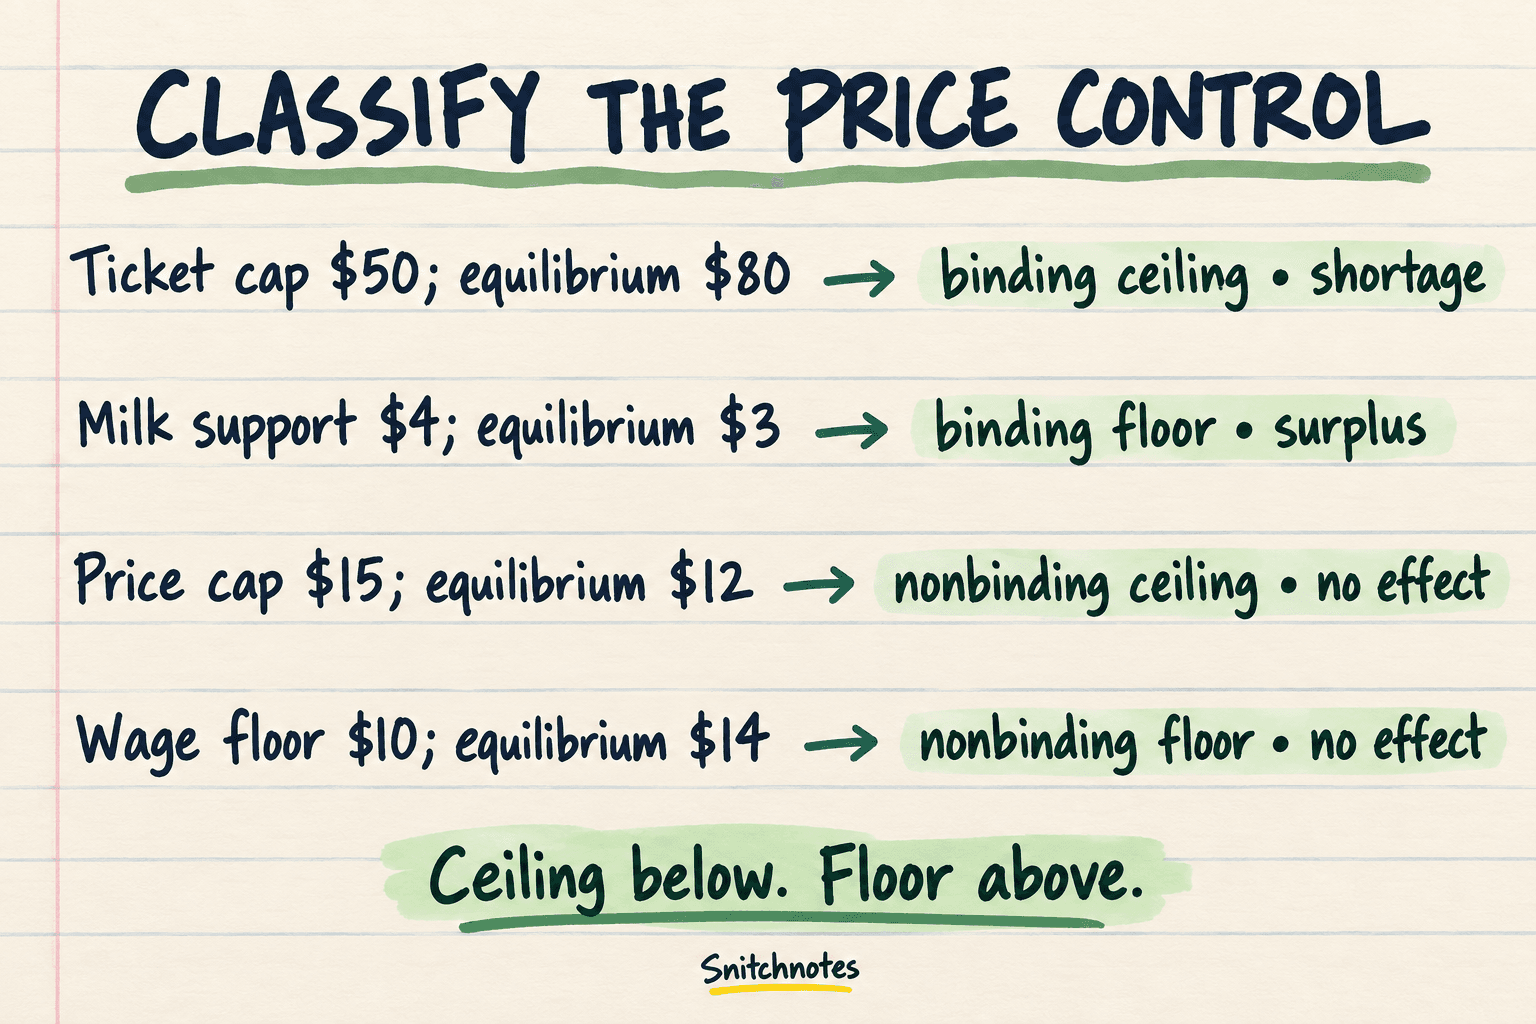
Here is the common trap: students memorize that ceilings cause shortages and floors cause surpluses, then forget the word binding. A price cap of $1,500 when equilibrium is $1,200 does nothing because sellers can already charge $1,200 without breaking the law. Likewise, a $10 wage floor below a $14 equilibrium does not lift the market wage.
Misconceptions and boundaries
A shortage does not mean zero supply, and a surplus does not mean zero demand. Each is a difference between two positive quantities at the controlled price. Also, the legal price and the market gap are different objects: the $900 ceiling is a price, while the 40-apartment shortage is a quantity. Keep the axes and units visible.
Finally, the simple diagram assumes a competitive market and holds other influences constant. Quality changes, side payments, search costs, government purchases, enforcement, and market power can change how a policy works in practice. Massachusetts Institute of Technology OpenCourseWare treats price ceilings and floors as welfare-analysis tools precisely because the full question includes who gains, who loses, and which trades disappear—not only the direction of the gap.
Check your understanding
A concert ticket cap is $50 and equilibrium is $80. What happens?
It is a binding price ceiling because the maximum is below equilibrium. In the basic model, quantity demanded exceeds quantity supplied, so there is a shortage.
A milk support price is $4 and equilibrium is $3. What happens?
It is a binding price floor because the minimum is above equilibrium. Quantity supplied exceeds quantity demanded, so there is a surplus.
A price ceiling is above equilibrium. Does it create a shortage?
No. It is nonbinding because the equilibrium price already satisfies the legal maximum. The market remains at equilibrium unless another condition changes.
If price-control graphs are scattered across your lectures and readings, Snitchnotes can turn your own course material into organized notes, flashcards, and quizzes for practice.
Related concepts
- Market equilibrium: the price and quantity where quantity demanded equals quantity supplied.
- Binding versus nonbinding constraints: whether a legal limit actually changes the market outcome.
- Deadweight loss: the value of mutually beneficial trades that disappear when quantity moves away from the efficient equilibrium.
- Asymmetric information: how unequal knowledge can affect market outcomes and allocation.
Sources
OpenStax: Price Ceilings and Price Floors
Federal Reserve Education: Market Equilibrium
Federal Reserve Bank of St. Louis: Why Price Controls Should Stay in the History Books
Massachusetts Institute of Technology OpenCourseWare: Price Ceilings and Price Floors
Turn your lectures into exam-ready materials.
Notes, quizzes, podcasts, flashcards, and chat — from one upload.
Try your first note free