
Snitchnotes Team
What to Do When Training Accuracy Is High but Test Accuracy Is Low
What to Do When Training Accuracy Is High but Test Accuracy Is Low
High training accuracy but low test accuracy means your model is not generalizing reliably to unseen examples. Overfitting is a common cause, but it is not the only one. A bad split, duplicated samples, inconsistent preprocessing, distribution shift, or even a mismatched metric can create the same pattern. Check the evaluation setup first; only then simplify or regularize the model.
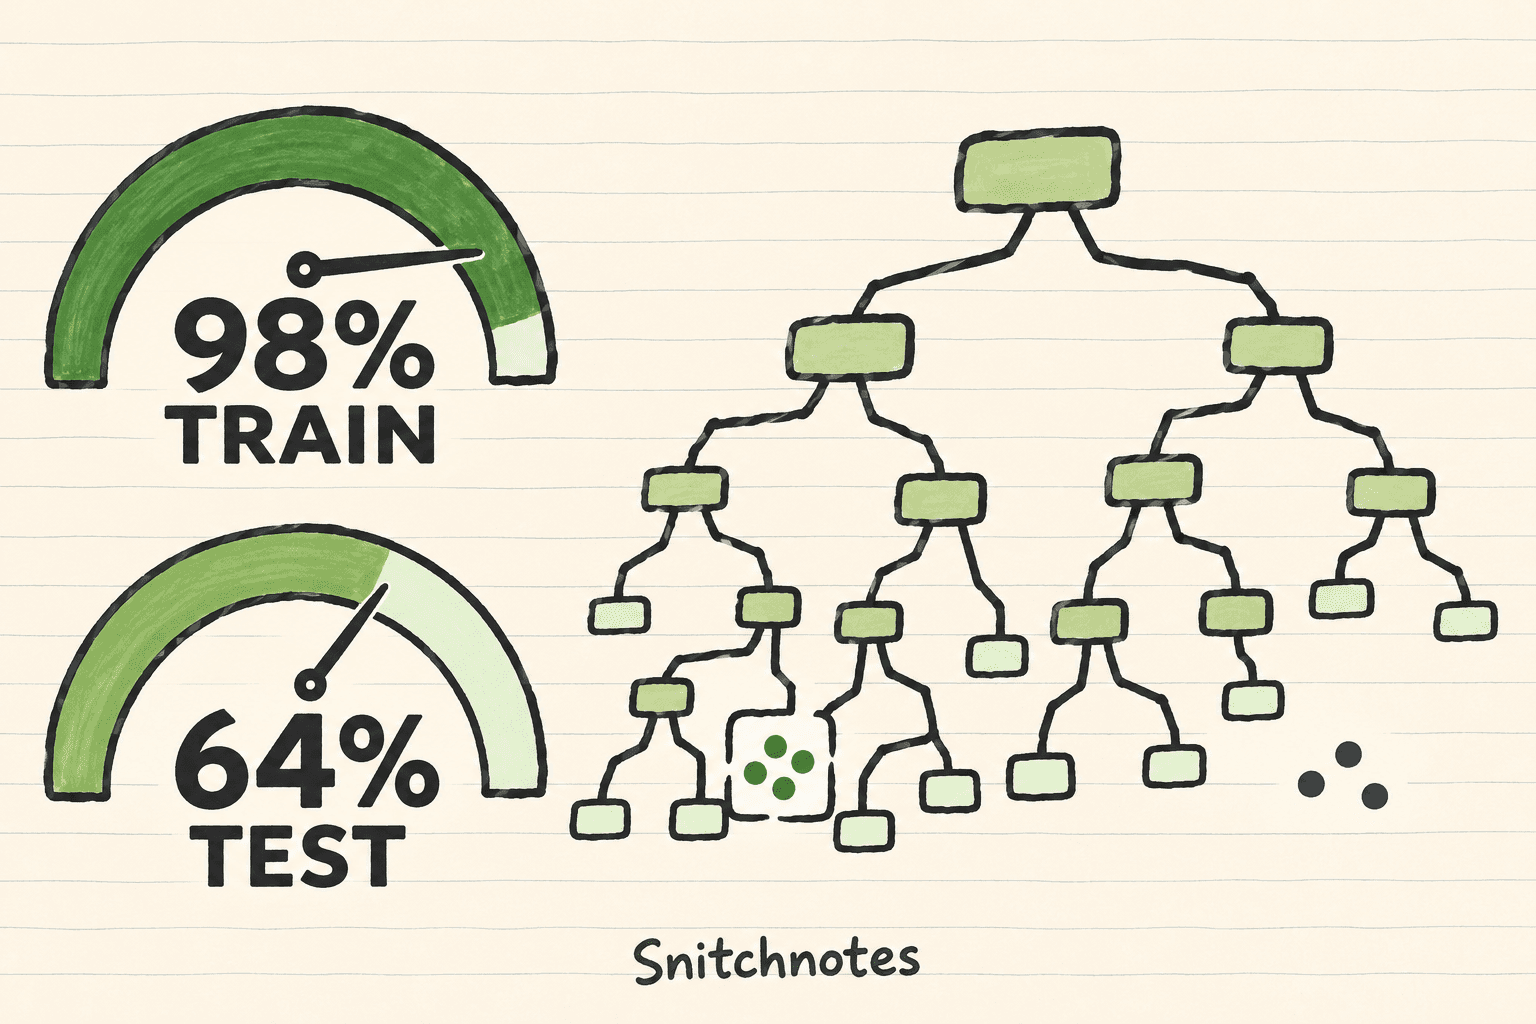
The difference between the two scores is the generalization gap. A model with 98 percent training accuracy and 64 percent test accuracy has a 34-percentage-point gap. That number is a warning light, not a diagnosis: it tells you where to investigate, not which repair to make.
Why the training-test gap matters
Training performance answers a narrow question: how well does the fitted model handle examples it learned from? Test performance asks the question you usually care about: how well does it handle fresh data? A model can memorize accidental details such as backgrounds, filenames, or repeated samples and still look excellent during training.
The test score is useful only if the test set represents the intended task and stayed separate from model development. If you repeatedly choose features or hyperparameters using the test result, the test set becomes part of the development loop. Keep a validation set for iteration and reserve the test set for a final, infrequent check.
Diagnose the gap in the right order
First, reproduce the result. Fix random seeds where appropriate, put the model in evaluation mode, and confirm that training and test accuracy use the same label mapping, threshold, averaging rule, and definition of accuracy. For an imbalanced problem, inspect a confusion matrix and per-class precision and recall too; plain accuracy may hide a model that mostly predicts the largest class.
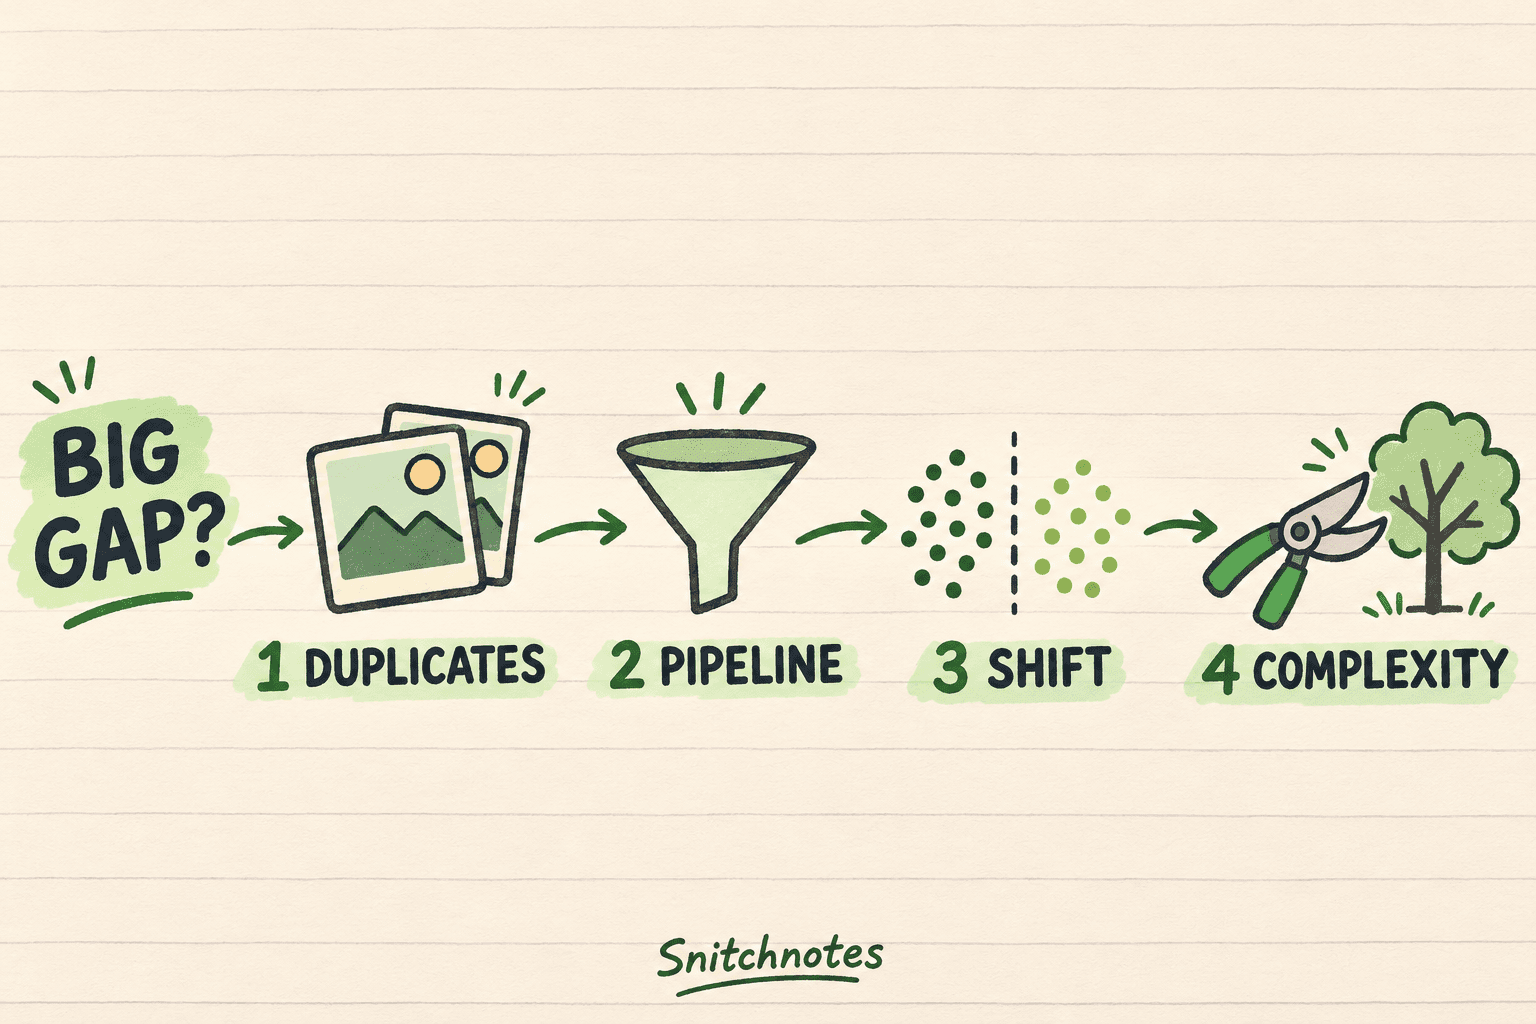
Second, audit the split before changing the model. Search for exact and near-duplicate images across partitions. If several crops came from one original photo, group them before splitting. For data tied to a person, device, location, or time period, split by that group rather than by individual row. Fit scalers, imputers, feature selectors, and vocabulary builders on training data only, then apply the learned transformation to validation and test data.
Third, compare the partitions. Check class balance, image size, collection source, missingness, and time range. Test performance can fall because the test examples genuinely differ from the training examples. That is distribution shift, and a larger model will not repair missing coverage. You may need a more representative training set, a time-aware split, or slice-specific evaluation.
Fourth, investigate model variance. If the data and metric checks pass, compare training and validation curves. A growing gap while training accuracy keeps rising is strong evidence of overfitting. Try one controlled change at a time: stronger weight decay, dropout where appropriate, early stopping, a smaller network, shallower trees, or more representative training examples.
A 98 percent versus 64 percent cat-and-dog classifier
Suppose a cat-versus-dog image classifier reaches 98 percent accuracy on 8,000 training images but only 64 percent on 2,000 test images. Do not immediately add dropout. Hash the files and use perceptual similarity to look for duplicates and near-duplicates. You discover that burst photos and augmented crops from the same original landed on both sides of the split. Rebuild the partitions by original image before augmentation.
Next, trace the image pipeline. Training images are resized, normalized, and randomly flipped; test images must receive the same deterministic resize and normalization, but not random augmentation. Then inspect slices. Perhaps most training dogs are outdoors while many test dogs are photographed on sofas. The model may have learned scenery as a shortcut, so add varied backgrounds or collect examples that better match deployment.
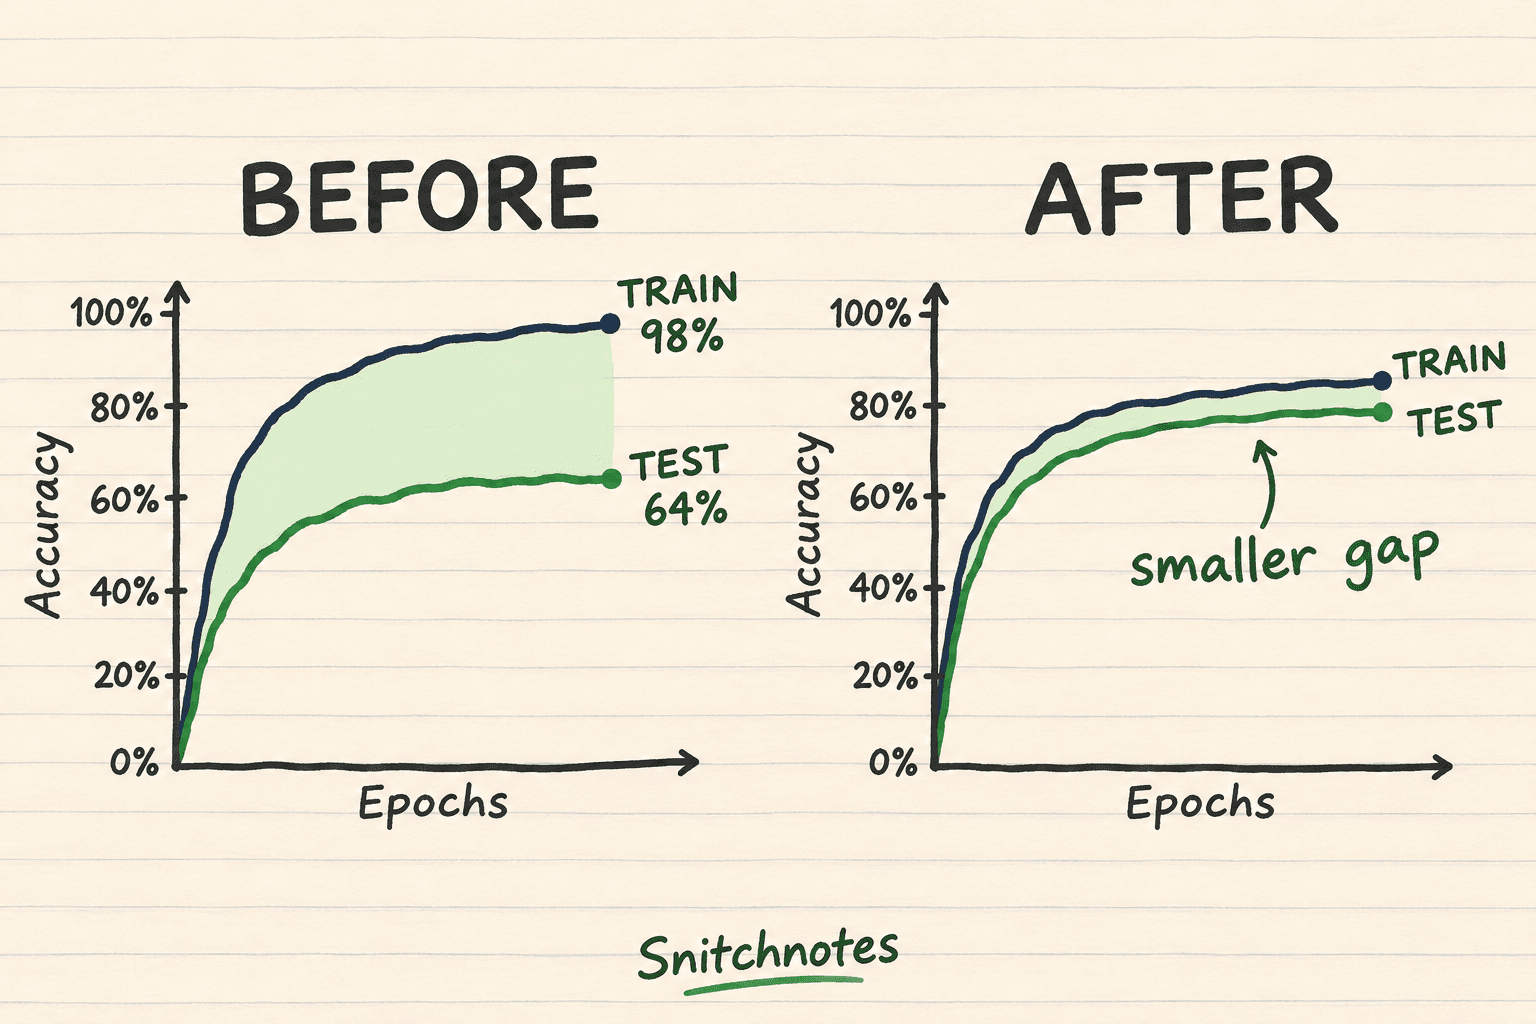
Finally, retest a smaller model under the corrected split and pipeline. If training accuracy falls from 98 to 88 percent while test accuracy rises from 64 to 81 percent, that is an improvement: the smaller gap and higher unseen-data score matter more than preserving a dazzling training score. Report the untouched test result only after selecting the model with validation data.
What learning curves tell you
Plot training and validation performance by epoch or by training-set size. If both scores are low and close together, the model may be underfitting, so more capacity or better features could help. If training performance is high while validation performance stalls, the model has high variance or the partitions differ. If the curves start together and then separate, use the best validation checkpoint rather than the final epoch.
Curves also help distinguish fixes. If validation performance keeps improving as you add data, more representative examples may help. If it remains flat despite more data, revisit labels, features, the metric, or the distribution mismatch. Treat the graph as evidence about the next experiment, not as proof that one favorite technique will work.
Common misconception: regularization is not the first universal fix
Regularization can reduce overfitting, but it cannot correct swapped labels, test-only preprocessing, duplicated groups, or a test set drawn from another population. Aggressive regularization may merely lower training accuracy while leaving the real evaluation bug untouched. The safe order is evaluation, split, pipeline, distribution, then complexity.
Also, a gap is not automatically unacceptable. Training examples are expected to be easier because optimization used them. The important questions are whether the test procedure is trustworthy and whether test performance meets the task's needs. For consequential systems, average accuracy alone is not enough; examine important subgroups, error costs, calibration, and uncertainty.
Check your understanding
Why should you audit the data split before adding regularization?
Because leakage, duplicates, and inappropriate grouping can make the evaluation misleading. Regularization changes the model, but it does not repair a broken measurement process.
What curve pattern suggests overfitting?
Training performance continues to improve while validation performance stops improving or gets worse, so the gap between the curves grows.
Why can a lower training score be good news?
If the change raises performance on properly held-out data and narrows the gap, the model is learning a more transferable pattern instead of memorizing training details.
If model diagnostics are buried across lectures and documentation, Snitchnotes can turn your slides, PDFs, and notes into clearer study notes, flashcards, quizzes, and audio for review.
Related concepts
- Generalization gap: the difference between performance on training data and performance on unseen data.
- Data leakage: information unavailable at prediction time influences model fitting or selection.
- Debugging code that passes examples but fails hidden tests: a related workflow for diagnosing failures on unseen cases.
- Compiler versus interpreter: a useful next concept for understanding how programs execute and fail.
Sources
Google for Developers: Overfitting
Google for Developers: Dividing the Original Dataset
scikit-learn: Common Pitfalls and Recommended Practices
University of California, Berkeley: Measuring Generalization and Overfitting in Machine Learning
Transforme tes cours en fiches prêtes pour les exams.
Notes, quiz, podcasts, flashcards et chat — en un seul upload.
Essaie ta première note gratuitement