
Snitchnotes Team
How to Interpret Enzyme Kinetics Graphs When the Curves Shift
How to Interpret Enzyme Kinetics Graphs When the Curves Shift
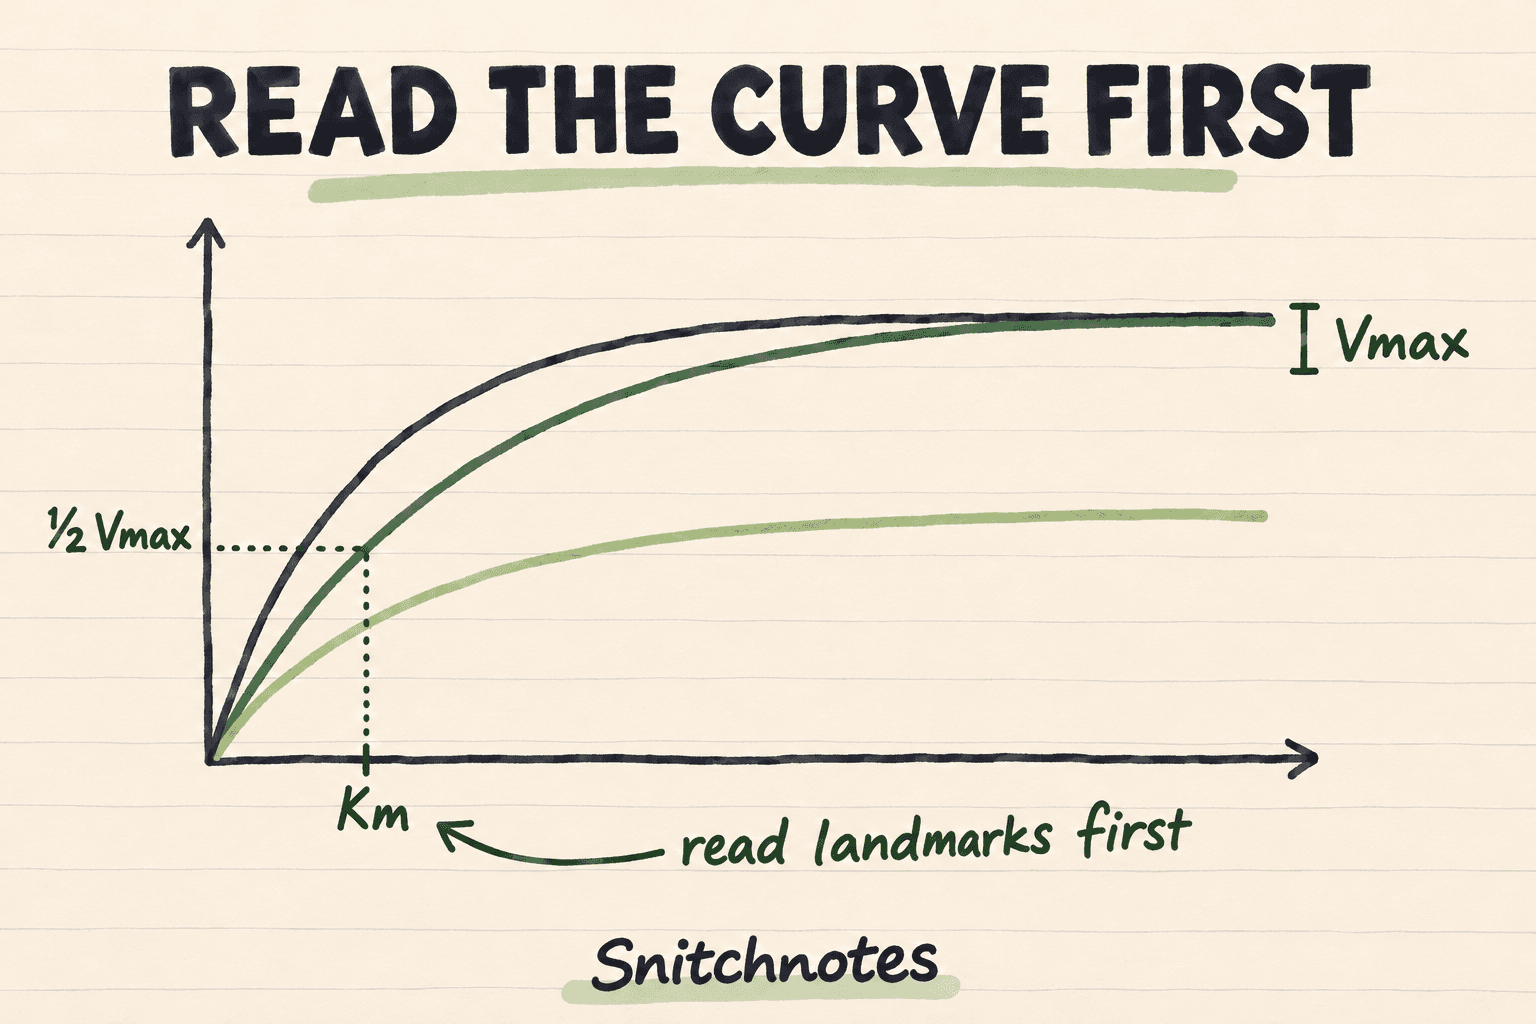
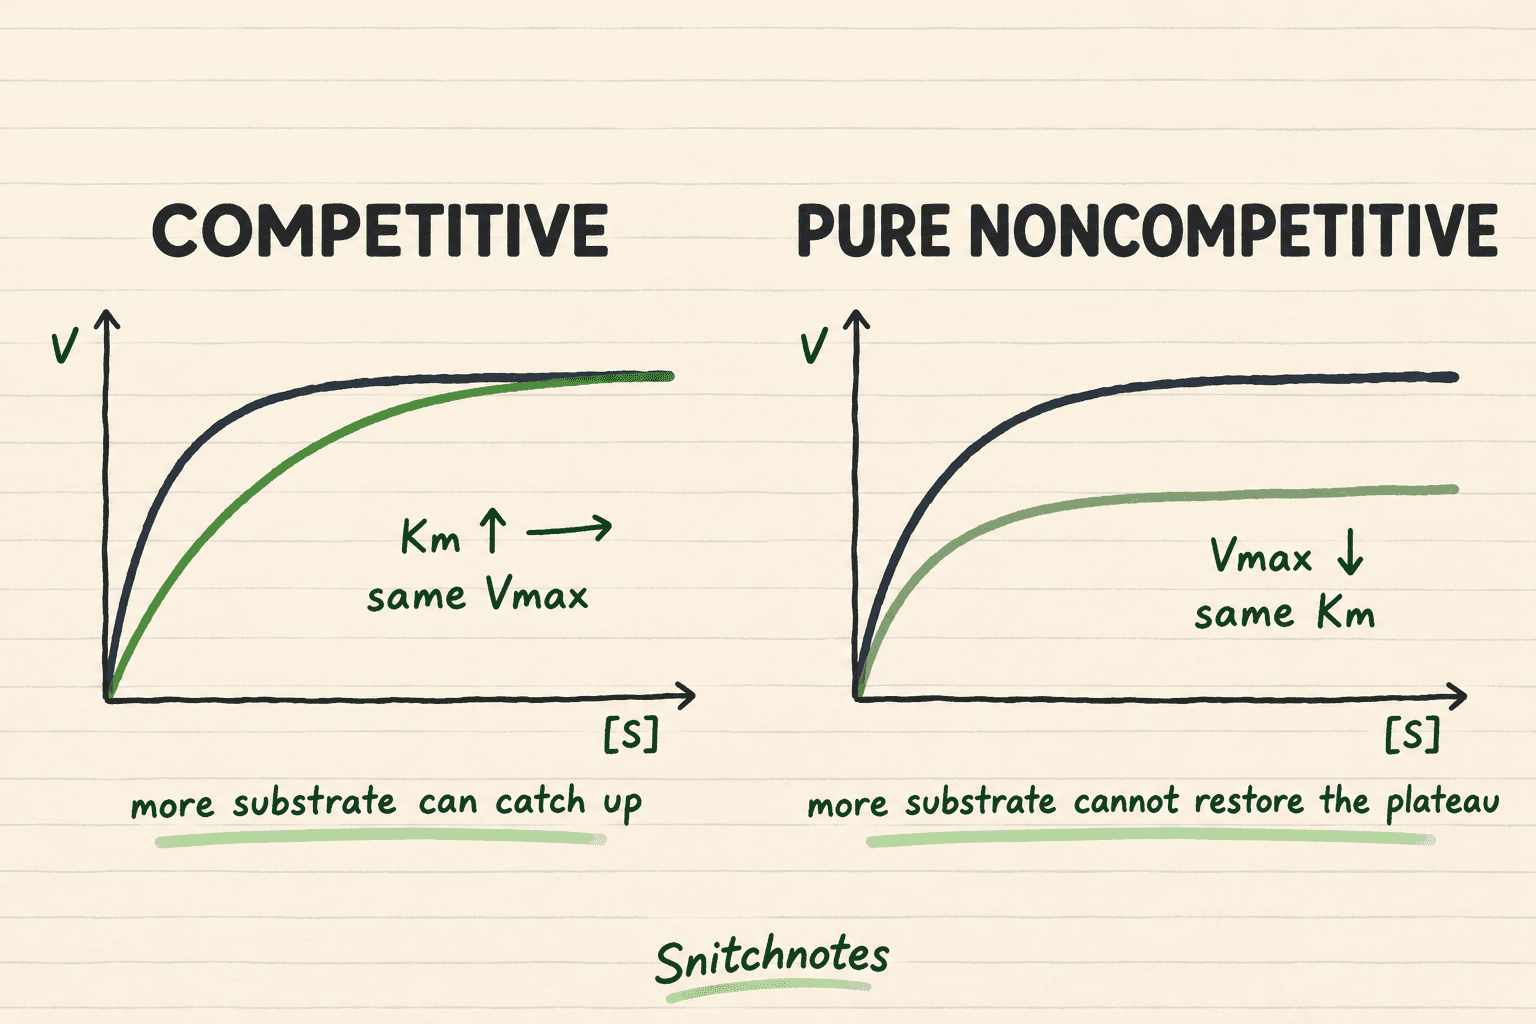
To interpret an enzyme kinetics graph, ignore the curve color at first. Check the axes, estimate each curve's apparent Vmax from its plateau, then find the substrate concentration at half of that curve's Vmax to estimate apparent Km. An unchanged Vmax with a higher Km fits competitive inhibition; a lower Vmax with unchanged Km fits pure noncompetitive inhibition. If both change, think mixed or uncompetitive inhibition rather than forcing a familiar label.
This landmark-first method matters because a shifted curve can look dramatic while representing only one changed parameter. Reading the graph before naming the inhibitor keeps memorized color schemes, line steepness, and visual guesswork from replacing evidence.
What Vmax and Km look like on the graph
On a standard Michaelis-Menten plot, substrate concentration [S] is on the horizontal axis and initial reaction velocity v₀ is on the vertical axis. The curve rises quickly and then approaches a plateau as available enzyme becomes saturated. That limiting rate is Vmax. Because Vmax is proportional to total enzyme concentration, changing how much active enzyme is in the assay can move the plateau even without changing the enzyme's substrate-binding behavior.
Km is read indirectly. Mark half of that curve's Vmax on the vertical axis, move horizontally to the curve, then drop to the substrate axis. The resulting [S] is Km for the Michaelis-Menten model. A smaller Km places the half-maximum point farther left; a larger Km places it farther right. Treat Km as a kinetic constant, not automatically as a pure measure of binding affinity, because its meaning depends on the reaction mechanism.
A curve-first checklist for unfamiliar graphs
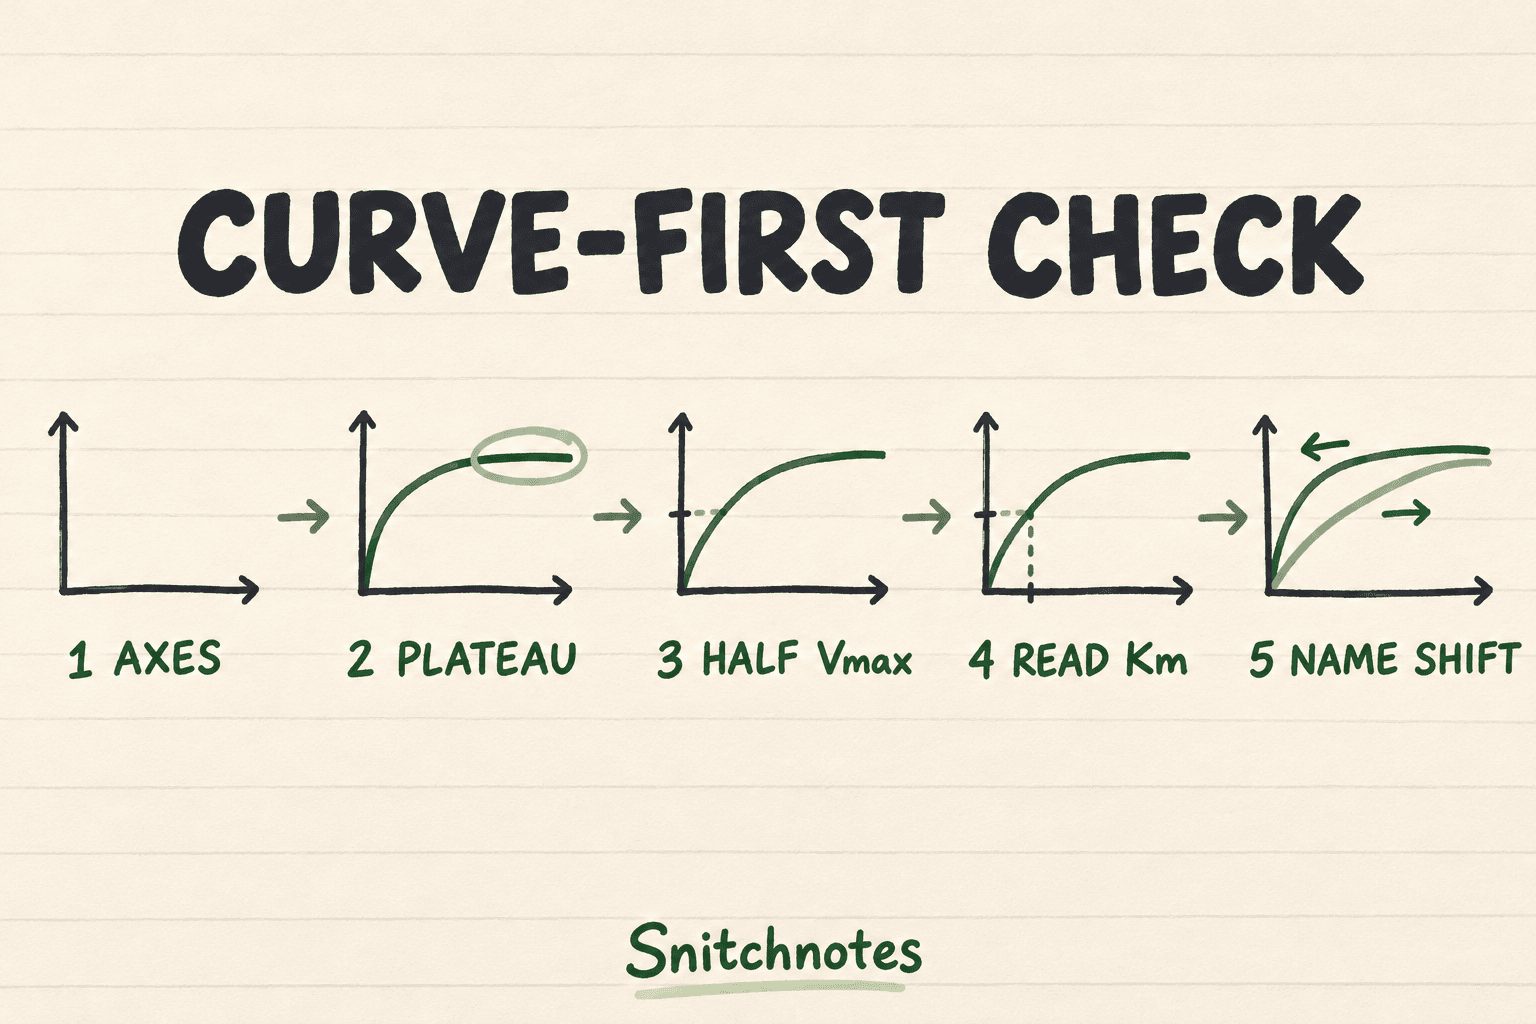
- Read both axes and units. Confirm whether the plot shows v₀ versus [S], reciprocals, or a progress curve versus time.
- Find each curve's own plateau. Compare apparent Vmax values before thinking about Km.
- Halve each curve's own Vmax. Do not use the control curve's half-maximum for every shifted curve.
- Read the corresponding [S] values to estimate apparent Km, then record whether each parameter rose, fell, or stayed the same.
- Name the pattern last and test it against the mechanism: can enough substrate overcome the effect, or does the lower plateau remain?
The word apparent is useful. Inhibitor concentration and assay conditions can change the fitted values you observe even though the uninhibited enzyme has not become a different molecule. Temperature, pH, enzyme concentration, substrate range, and data quality can also shift a curve, so an inhibitor label requires experimental context.
Worked comparison: three curves, two different shifts
Suppose the uninhibited reaction plateaus near 100 units/min. Half is 50 units/min, reached at about 2 mM substrate, so the baseline apparent values are Vmax = 100 units/min and Km = 2 mM. Now compare two shifted curves using those landmarks rather than their colors.
Curve A still approaches 100 units/min, but reaches 50 units/min at about 6 mM. Its apparent Vmax is unchanged while apparent Km triples. That pattern fits competitive inhibition: more substrate is needed to reach the same fraction of Vmax, yet sufficiently high [S] can approach the original plateau.
Curve B plateaus near 50 units/min. Half of its own plateau is 25 units/min, reached at about 2 mM. Its apparent Vmax has halved while apparent Km is unchanged, fitting pure noncompetitive inhibition. Adding substrate cannot restore the missing catalytic capacity, so the curve remains below the control at high [S].
Verify the pattern with substrate concentration
At 20 mM substrate, the Michaelis-Menten equation predicts about 91 units/min for the baseline values, 77 units/min for Curve A, and 45 units/min for Curve B. Curve A is closing the gap as [S] rises because its Vmax is still 100 units/min. Curve B is already near its lower 50 units/min ceiling. The high-substrate behavior confirms what the landmarks suggested.
What changes on a Lineweaver-Burk plot
A Lineweaver-Burk plot uses 1/v₀ on the vertical axis and 1/[S] on the horizontal axis. Its y-intercept is 1/Vmax, its x-intercept is −1/Km, and its slope is Km/Vmax. Competitive-inhibition lines share the y-intercept because Vmax is unchanged. Pure noncompetitive lines share the x-intercept because Km is unchanged.
Reciprocal plots magnify error from low-substrate measurements, so modern parameter estimation often fits the nonlinear Michaelis-Menten curve directly. For classroom interpretation, however, the intercept rules remain useful. Translate the axes first: a higher y-intercept means a lower Vmax, while an x-intercept moving toward zero means a larger Km.
Misconceptions and boundaries
Do not call every lower plateau noncompetitive inhibition. A lower Vmax with a changed Km is mixed inhibition; parallel shifts on a Lineweaver-Burk plot classically fit uncompetitive inhibition, where both apparent Vmax and Km decrease. Pure noncompetitive inhibition is the special case in which an inhibitor binds free enzyme and enzyme-substrate complex equally, so Km stays unchanged.
Also distinguish a Michaelis-Menten curve from a progress curve. A progress curve plots substrate or product against time, and its initial slope supplies one v₀ value. You need several initial velocities measured at different starting substrate concentrations to build a Michaelis-Menten plot. Cooperative enzymes may produce sigmoidal rather than hyperbolic curves, so this two-parameter reading method is not universal.
Check your understanding
A curve has the same plateau but reaches half-maximum farther right. What changed?
Apparent Vmax stayed the same and apparent Km increased. In a simple inhibition question, that pattern supports competitive inhibition.
A curve has a lower plateau. Where should you measure Km?
Use half of the shifted curve's own lower Vmax. Reusing half of the control Vmax can make Km impossible to read or create a false horizontal shift.
Can a curve shift without an inhibitor?
Yes. Enzyme concentration, pH, temperature, substrate range, measurement timing, and loss of enzyme activity can change the observed curve. The graph identifies parameter changes; the experiment identifies their cause.
Related concepts
- Initial velocity: the early reaction rate measured before substrate depletion and product accumulation distort the estimate.
- Turnover number: kcat relates Vmax to the total enzyme concentration.
- Study metabolic pathways with input-output maps: connect enzyme behavior to pathway-level reasoning.
- How to study histology for medical school and lab practical exams: apply a visual landmark method to tissue identification.
Sources
New York University School of Medicine: Enzymes—Michaelis-Menten kinetics
University of Washington: Enzyme Kinetics and Reversible Inhibition
University of Guelph BIOC 2580: Experimental Enzyme Kinetics, Linear Plots, and Enzyme Inhibition
Transforme tes cours en fiches prêtes pour les exams.
Notes, quiz, podcasts, flashcards et chat — en un seul upload.
Essaie ta première note gratuitement