
Snitchnotes Team
How to Study Historical Chronology With a Parallel Timeline
How to Study Historical Chronology With a Parallel Timeline
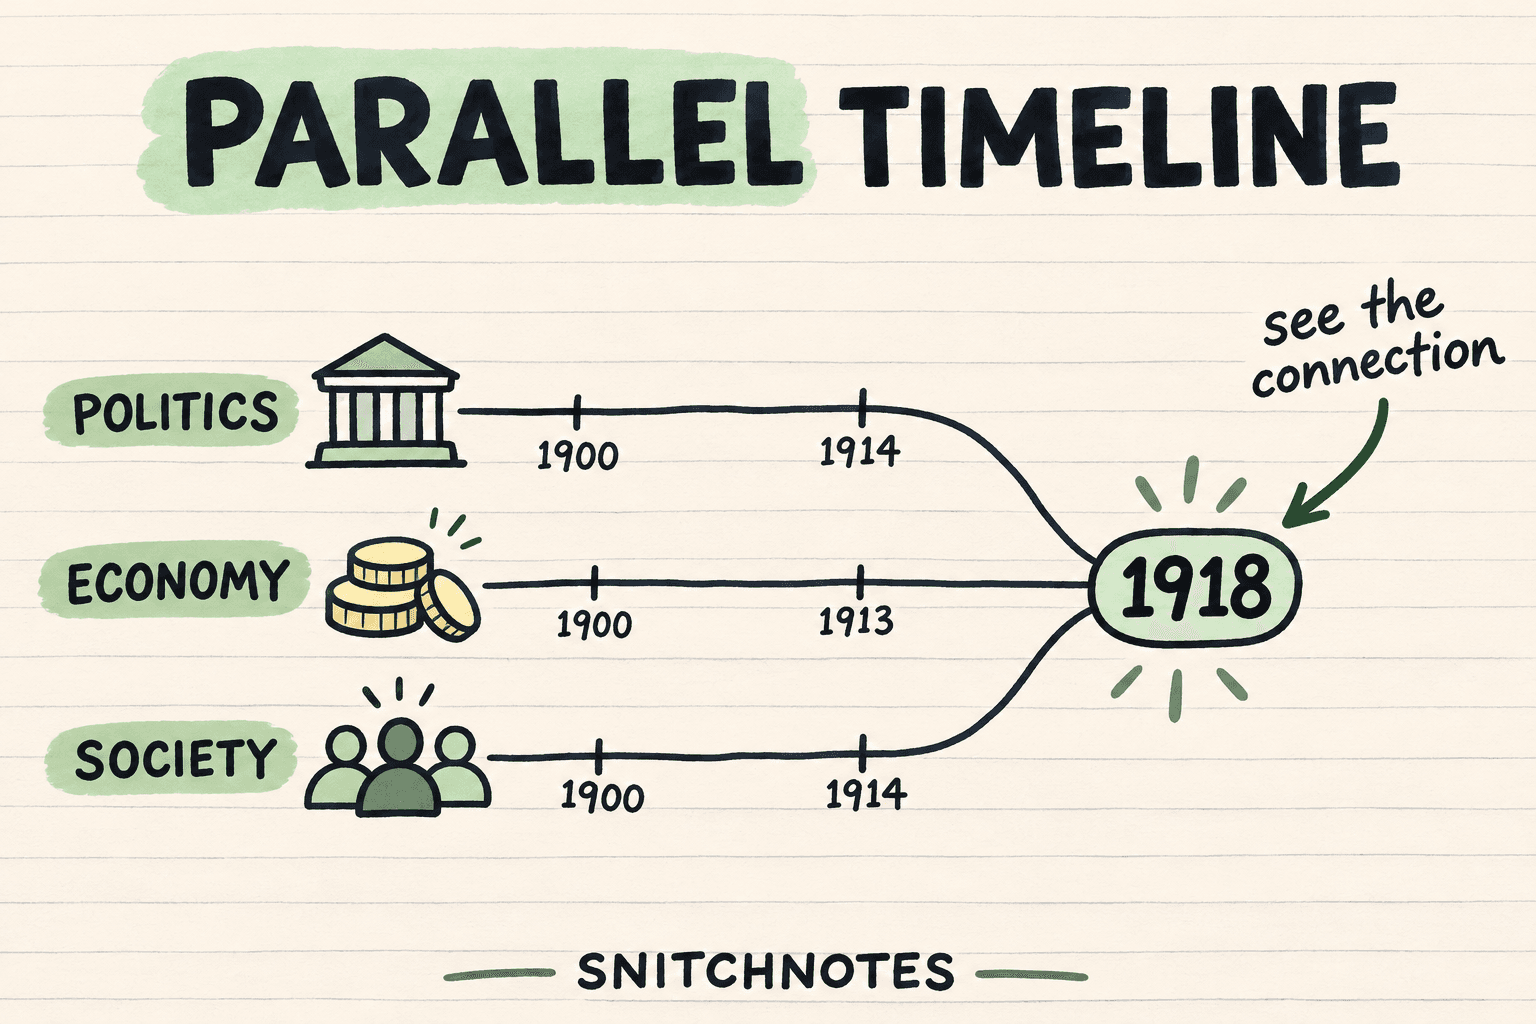
To study historical chronology, draw one shared time scale and place related developments on separate parallel tracks, such as politics, the economy, and society. Start with a few anchor dates, add only events that explain what changed between them, and then look across the tracks for connections. This makes dates evidence for an explanation instead of an isolated list to memorize.
A normal timeline answers “what came next?” A parallel timeline also asks “what was happening elsewhere at the same time?” That second question matters because historical change rarely stays in one lane. A law may sit on the political track, while the pressures surrounding it appear in work, war, protest, technology, or everyday life.
What a parallel timeline is
A parallel timeline uses the same dates across two or more horizontal tracks. Each track represents one strand of the topic. Because the scale is shared, events that happen together line up vertically. You can see sequence within a track and simultaneity across tracks without squeezing everything onto one crowded line.
Use three tracks as a practical default. More tracks can become a copying project rather than a thinking tool. Choose categories that fit the question: for a revolution, you might use government, prices, and popular action; for a war, military events, production, and civil rights may be more useful. The headings should help you explain the period, not merely sort your notes.
Set one scale and three useful tracks
- Define the window. Write a clear start and end date. A five-year window needs different detail from a century-long survey.
- Keep one scale. A year must occupy the same horizontal position on every track, or apparent connections will be misleading.
- Name explanatory tracks. Use categories that answer the essay question or learning objective rather than generic headings you reuse automatically.
Leave space between the tracks for arrows or short notes. Those cross-track annotations are where chronology becomes reasoning: “created pressure for,” “accelerated,” “limited,” or “continued despite” are more useful than decorative color coding.
Choose anchor dates before interval events
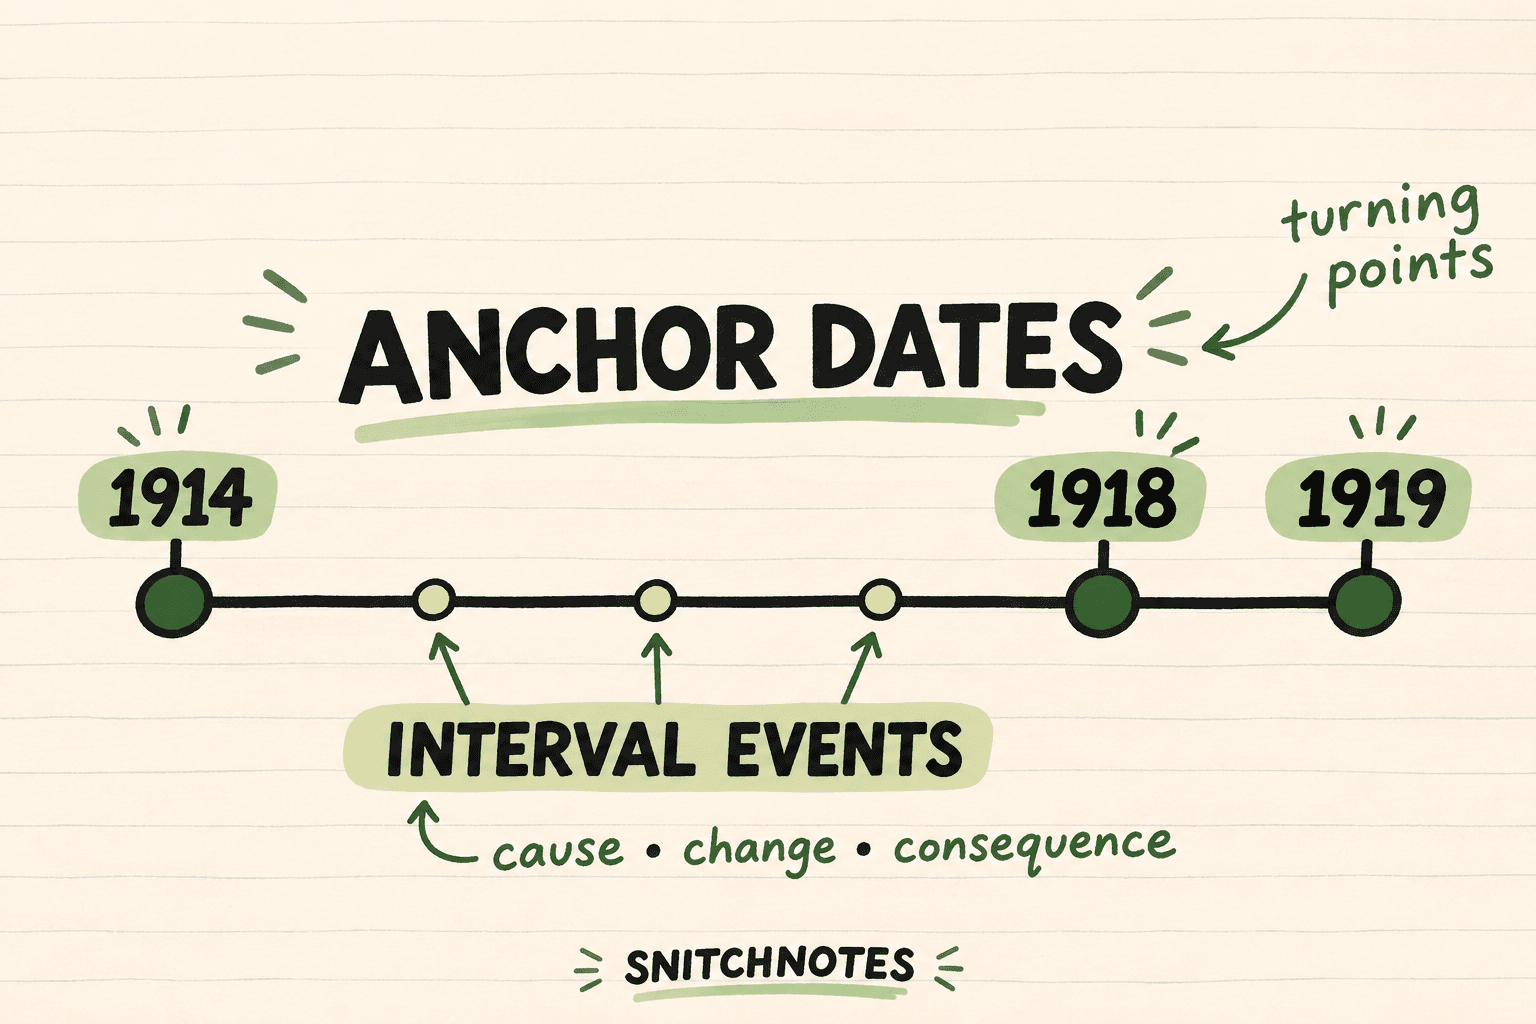
Anchor dates are the period's turning points: the beginning or end of a conflict, a major law, a change of government, or another event your course treats as structurally important. Pick three to five anchors for a short period. Place them across all tracks first, even if an anchor belongs mainly to one strand.
Next, add interval events only when they do one of three jobs: show a cause developing, mark a change in direction, or reveal a consequence. If a date does none of these, keep it in your detailed notes rather than forcing it onto the diagram. This rule prevents the timeline from becoming a miniature textbook page.
Worked example: Britain from 1914 to 1919
Suppose the question is how wartime change relates to British voting reform. Draw a 1914–1919 scale with three tracks: military and political events, women's paid work, and voting rights. Mark 1914 for Britain's entry into the First World War, 1918 for the Representation of the People Act and the armistice, and 1919 for the immediate postwar transition.
On the work track, note the wartime expansion of women's employment into areas including munitions, transport, clerical work, and other roles affected by mobilization. On the rights track, begin before 1914 with the long suffrage campaign, then place the 1918 Act. UK Parliament records that the Act enfranchised all men over 21 and certain women over 30 who met a property qualification; it did not create equal voting terms for women and men.
Now read vertically at 1918. War, altered work patterns, democratic reform, and an established suffrage movement occupy the same historical moment. The crossing suggests a question, not a shortcut: how did these pressures interact? Imperial War Museums cautions that the war's effects on women's lives were mixed, including both new opportunities and postwar displacement. The parallel view therefore resists the neat but misleading claim that one wartime factor single-handedly “caused” the vote.
Turn crossings into causal questions
A vertical alignment proves simultaneity, not causation. When two events line up, test the relationship with three questions: What mechanism could connect them? What evidence shows people at the time made that connection? What other causes or longer trends were already operating? Add an arrow only after you can answer at least the first question.
Also look for lags. A social change may begin before a law recognizes it, or a policy may have consequences years later. Use arrows that can travel diagonally across time rather than assuming every important relationship happens in the same year. Chronology gives causal arguments their boundaries: cause must precede effect, but sequence alone is not enough.
Review with a blank-to-recall cycle
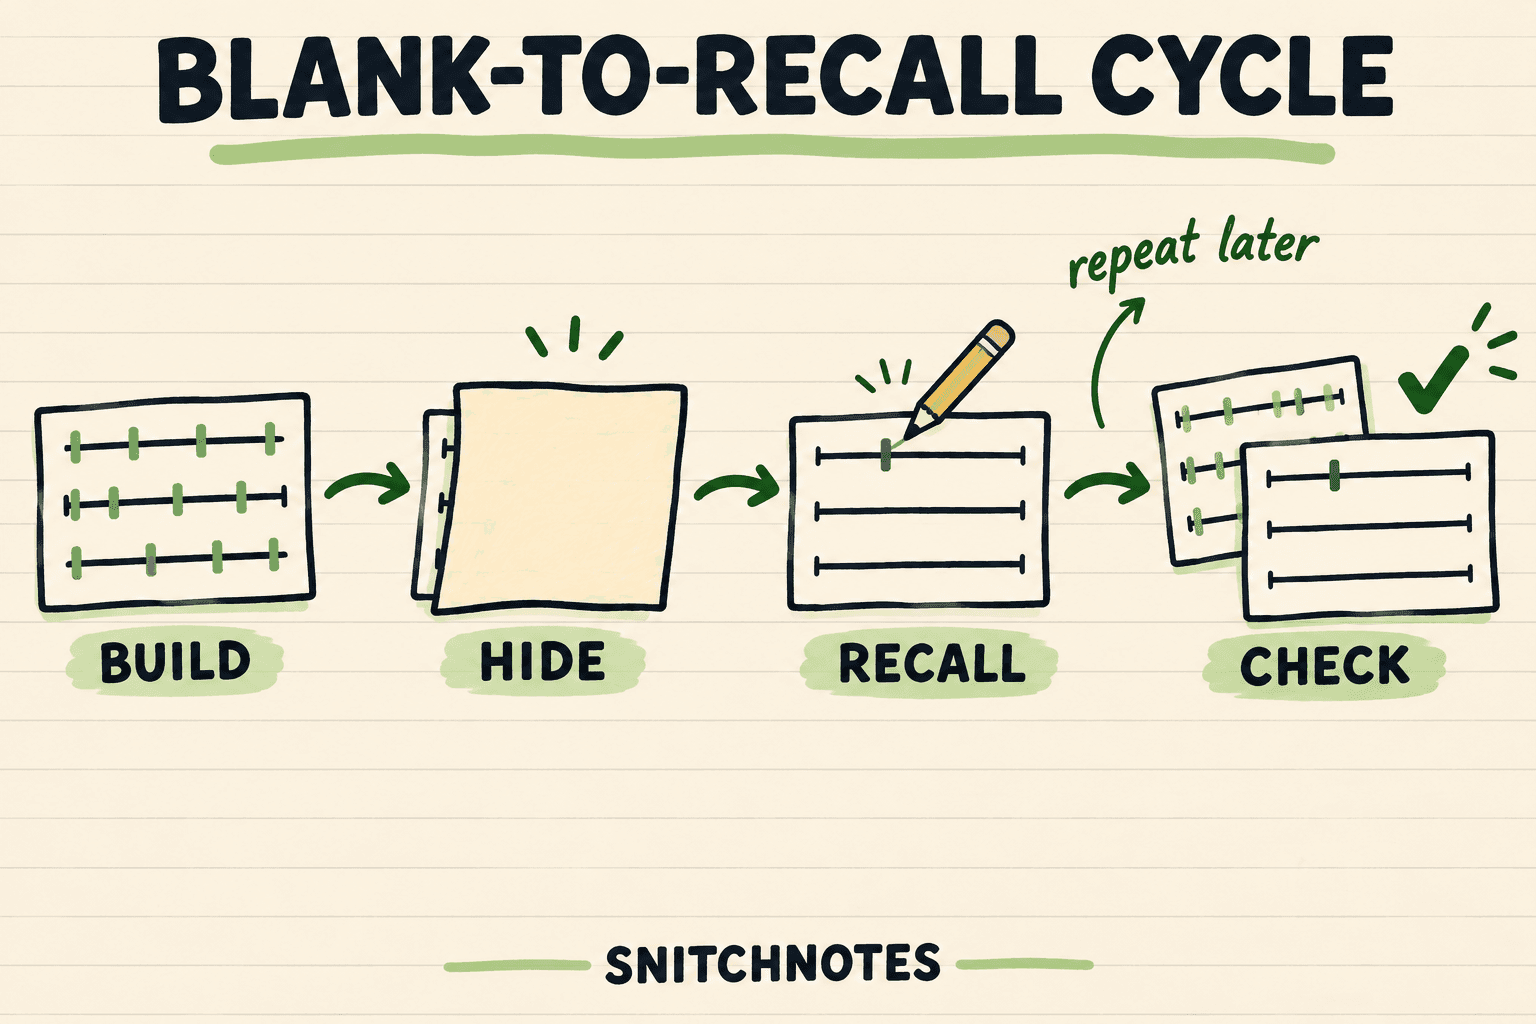
- Build the parallel timeline once from your textbook, lecture notes, and primary sources.
- Hide it and redraw the empty tracks with only the start and end dates visible.
- Recall the anchors, interval events, and cross-track explanations without looking.
- Check against the original, correct a different color, and repeat after a delay.
This turns the diagram into retrieval practice rather than a poster you repeatedly reread. Research by Jeffrey Karpicke and Henry Roediger found that continued retrieval can strengthen long-term retention, while a major review by John Dunlosky and colleagues rated practice testing and distributed practice as high-utility learning techniques. The useful struggle is reconstructing the sequence and relationships before checking.
Common mistakes and boundaries
- Too many dates: if every lecture detail appears, anchors disappear. Keep the timeline selective and your notes comprehensive.
- Unequal scales: do not stretch one track to make events look closer together than they were.
- Causation by proximity: events that align may share a context without one causing the other. Verify the mechanism with evidence.
- Forcing precision: some processes unfold gradually. Use a shaded span or approximate range rather than inventing one decisive date.
Check your understanding
Why must every track use the same scale?
A shared scale makes vertical alignment meaningful. If the spacing changes between tracks, events can appear simultaneous or close together when they were not.
What belongs between two anchor dates?
Add events that explain a cause, change, or consequence between the anchors. Leave out facts that do not help answer the historical question.
Does a vertical crossing prove causation?
No. It proves that developments overlapped in time. A causal claim still needs a plausible mechanism and supporting evidence, while accounting for other causes.
If your history notes contain the right facts but not the relationships, Snitchnotes can turn your own lectures, slides, and PDFs into organized notes, flashcards, and quizzes for the blank-to-recall cycle.
Related concepts
- Study historical causation with cause-and-consequence chains to test mechanisms after the timeline reveals a possible connection.
- Primary vs secondary sources: use each type of evidence for a different part of your historical explanation.
Sources
UK Parliament, Representation of the People Act 1918
Imperial War Museums, Did the First World War Transform Women's Lives?
Karpicke and Roediger, The Critical Importance of Retrieval for Learning, Science
Dunlosky et al., Improving Students' Learning With Effective Learning Techniques, PubMed
Trasforma le tue lezioni in materiale pronto per l'esame.
Appunti, quiz, podcast, flashcard e chat — da un solo upload.
Prova il primo appunto gratis